Getting Xdebug working with PHP
DebuggingAfter all these years I've decided to give Xdebug a try again. I tried a few times in the last 5 years, and maybe got it right once, but definitely failed again. So let's start this journey again.
This time I want to get it working with Cursor, which is a clone of Visual Studio code.
I guess this AI response says it all:
"Setting up Xdebug in Visual Studio Code involves three main steps: installing the Xdebug PHP extension, configuring your PHP environment, and installing and configuring the VS Code debugger extension."
I use Herd so I think I'll also need to do "something" for Herd. I see there is an entire chapter:
https://herd.laravel.com/docs/macos/debugging/xdebug
Even there, they have this shiner:
"If Xdebug is too much for you and you prefer debugging via dumps, check out the Dumps of Herd Pro."
Well yes, so far Xdebug was too much for me and I fell in love with Spatie's Ray, but now I'm starting to see the light.
Following the manual further, and thankfully a subscriber to Herd Pro, I see this message:
"Looking for an even easier way to debug your applications? Check out Herd Pro’s Xdebug integration. It can automatically detect breakpoints in your application and enable Xdebug on-the-fly when necessary."
I haven't even started the work yet and I'm being branched. Let's see what next.
https://herd.laravel.com/docs/macos/debugging/xdebug-detection
At this point the documentation only mentions PhpStorm, meaning of course, I'm back to the start.
I have a clue something is amiss, because I'm kind of expecting this to produce output:
php -i | grep -i xdeb
I'm also "almost" quite sure Herd is controller the PHP version. So back to Herd then.
Herd has different instructions for Apple Silicon versus Intel, and this seems to be the way on my Apple Mini M2:
zend_extension=/Applications/Herd.app/Contents/Resources/xdebug/xdebug-83-arm64.so
xdebug.mode=debug,develop
xdebug.start_with_request=yes
xdebug.start_upon_error=yes
Thankfully I navigate using Herd's menus to editing of configuration files, and there it is. I just have to uncomment it and then restart the Herd Services. Kind of made me think why on earth it's just not enabled by default if it's so powerful?
Next, the php info command produces the correct output. But you will cry when you see the options, so I only show the top:
php -i | grep -i xdeb
    with Xdebug v3.3.1, Copyright (c) 2002-2023, by Derick Rethans
Next I have to scout the marketplace for a plug. I find these two:
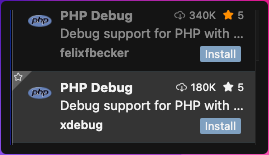
I see some instructions after installing the plug about version 2 versus version 3 but I just squint my eyes and look away.
Further down the extension installation dialogue I see these instructions about a gear, which I have never even used:
In your project, go to the debugger and hit the little gear icon and choose PHP. A new launch configuration will be created for you with three configurations:
Listen for Xdebug This setting will simply start listening on the specified port (by default 9003) for Xdebug. If you configured Xdebug like recommended above, every time you make a request with a browser to your webserver or launch a CLI script Xdebug will connect and you can stop on breakpoints, exceptions etc.
Launch currently open script This setting is an example of CLI debugging. It will launch the currently opened script as a CLI, show all stdout/stderr output in the debug console and end the debug session once the script exits.
Launch Built-in web server This configuration starts the PHP built-in web server on a random port and opens the browser with the serverReadyAction directive. The port is random (localhost:0) but can be changed to a desired fixed port (ex: localhost:8080). If a router script is needed, add it with program directive. Additional PHP/Xdebug directives trigger debugging on every page load.
By this time, I wish for Ray (again).
Press on, mate.
Somehow I find this menu. Apparently called "Run and Debug" or shift command D.
It creates a 'launch.json' file in .vscode directory, which I think I'll never find again, nor understand given my time on this earth.
So what now?
I can see the line in my code I want to "xdebug", but what to do?
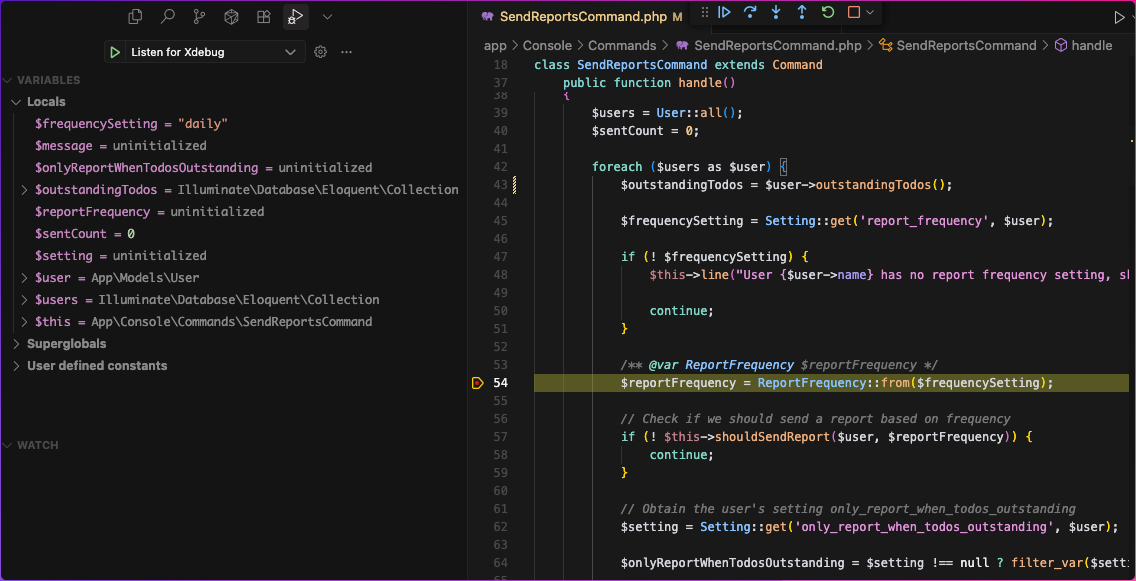
I add a red dot in the line, and then click a play button. This warns me:
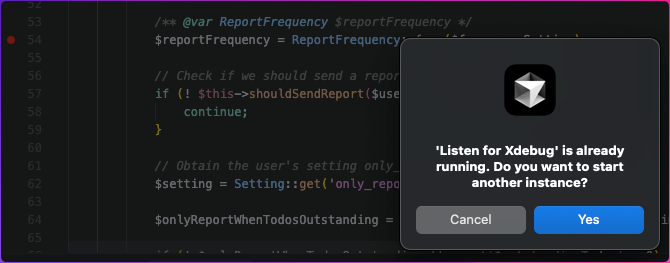
I run my Pest test, and then, voilá! There it is! I can see my variables! Yay!
The honeymoon was over after about two hours. I moved away from Cursor for two hours and did other work. When I returned to edit my code and do more debugging, I got this shiner:
➜  todomagic git:(main) ✗ art test
Xdebug: [Step Debug] Could not connect to debugging client. Tried: localhost:9003 (through xdebug.client_host/xdebug.client_port).
This repeated a gazillion times over and I couldn't fix it.